After being a developer for so long - Fortran in 1979 followed by Pascal, C, Java, and settling on python in 1997 - I’m no stranger to memory leaks and spikes. I still love hunting down bugs. It’s safe to say I have come to realize that no problem is ever above you. Well, after 35 years in technology, working for companies big and small, my problem solving skills were put to the test yet again.
Ben Reeves
Director of AI
My python program, which does machine learning for Natural Language Processing, when running on large data sets, was being abruptly terminated. On an AWS EC2 instance running Ubuntu 20.04, it read only “Memory Error” with no stack trace. What’s worse, it happened at different times - sometimes after running for 7 hours, then on the exact same inputs this happened after only 2 hours, and another time up to 17 hours. This is notoriously difficult to debug, though both AWS and Python have tools for it. In this article I’ll describe my experience using these tools.
Investigation #1: AWS tools for memory usage
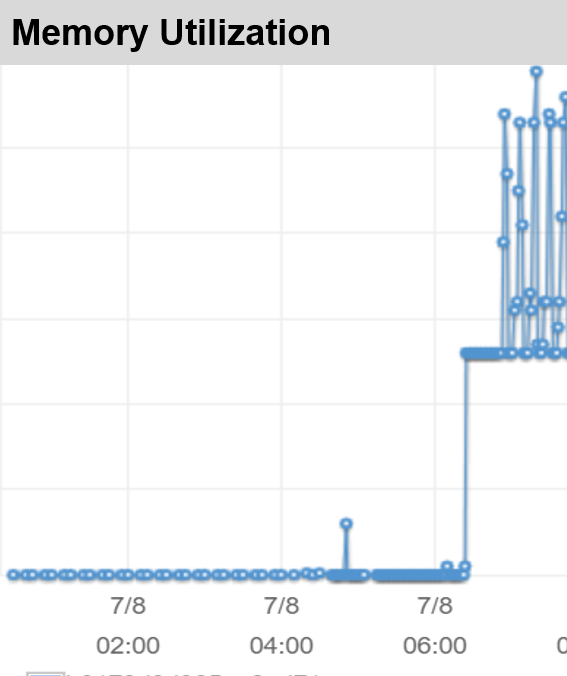
The AWS memory monitor showed noisy, but increasing memory usage — with tall spikes. When that spike rose above the memory allocated for my instance, (16GB) the program would then terminate. These spikes were of various heights. My first response was to let it run to the end by greatly increasing the memory available. This would require creating a new instance, but I don’t know how much memory is needed: it depends on how high the spikes were. Easier, cheaper, and more flexible is to add swap space by increasing the disk space and assigning some of it to a swap file. It will run a bit slower, but that can be mitigated by using a SSD and increasing “swappiness.” To add 50GB, the commands on Ubuntu are as follows:
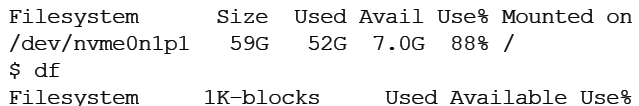
1. See how much disk space you have available by using the df command, and look in the “Available” column. df -h . The result will look like this:
2. In this example only 7GB are available, so I need to increase the disk size to at least 59G-7G-50G=102G. I’ll extend it to 110G to allow for overhead due to formatting and GB to GiB conversion. (Follow the instructions in this short Medium article). During that procedure, verify that your Volume Type is SSD to avoid the swap being painfully slow.
3. Make your system recognize the increased disk size:
df -h . The result shows that it does, and there was about 3 GB of overhead- this is typical.
append a line to /etc/fstab using the nano editor sudo nano /etc/fstab
/var/swapfile none swap defaults 0 0 # exit the nano editor, and write the fstab file.
# if your swap size >> memory size, setting swappiness to 80 # will make it run a bit less slowly:
sudo nano /etc/sysctl.conf vm.swappiness=80 # if your swap size >> memory size
# exit nano. To invoke it without rebooting, sudo sysctl -p
# activate the swap now, and see whether it’s recognized free -ht # take note of the total memory and swap
sudo swapon -a free -ht # compare to before swapon.
Investigation #2: python’s tools to locate memory leaks
Python’s Memory Profiler “mprof” samples memory usage 10 times per second, which is much more frequently than AWS’ memory monitoring. There are better to detect memory spikes that might arise from lines like this: corpus = [tokenize(doc) for doc in documents]
So, I installed mprof and ran the program to completion. I hoped there would be enough memory. Using an SSD type disk and a high “swappiness” value mitigates the swapping overhead.
pip install -U memory_profiler
In your python file add this before your top level function, say it’s called main(): from memory_profiler import profile @profile def main(): In your shell, run it with this command line: mprof run python myprogram.py
Observe the amount of memory taken after it completes - or while it’s running:
mprof plot
If you get an error about “DISPLAY” not set, use this command: mprof plot --output=x.pdf
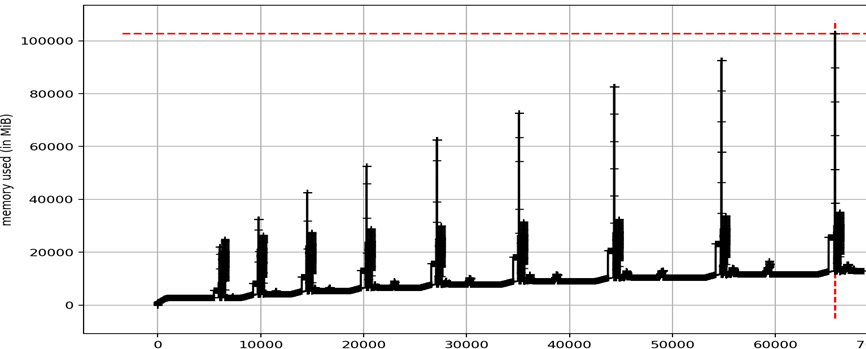
And copy “x.pdf” to your local machine to display it. It ran to completion! After 19 hours, I got:
From this I saw that we have a small memory leak but the spikes are the bigger problem; and some are over 32+50=82GB! MIssing a few spikes might explain why it was terminating at various different times. But the major takeaway is that hunting down the spikes is most urgent.
An mprof plot shows when the spike occurs, but not where nor why. Python has some tools for analyzing memory leaks, including: pdb-mmem, pympler and muppy (described in this medium article); I found their reports showed large blocks of memory located inside imported modules, over which I have no control. Tracemalloc, (described here) is good for detecting leaks, but the short spike may not appear because you still need to know where to call its compare_to() method. To find where the spike came from, I had to translate mprof’s time value (x axis) to a line number. For this, I used frequent calls to python’s logger module, each of which outputs a line number and a timestamp to a log file. This generated a gigantic log file. I needed a better tool to find where in the code this spike occurs.
Investigation #3: The winner is...
resource.setrlimit() was the function I needed. It forces a stack trace when the memory exceeds a threshold. Armed with my mprof plot, I knew where to set that threshold, using the following code:
import resource
def setMemoryLimit(n_bytes):
""" Force Python to raise an exception when it uses more than
n_bytes bytes of memory. """ if n_bytes <= 0: return
soft, hard = resource.getrlimit(resource.RLIMIT_AS)
setMemoryLimit(29_000_000_000) # use _ for readability
Then, I ran my code again. After a few hours, I saw a beautiful stacktrace implicating this line:
logger.debug(f"df is \n{df.to_string()}")
But, my logging level was set to info! Why was this line executed? Suddenly, I remembered a warning from a document read long ago: don’t use f-strings in logging, because they are evaluated before they’re executed. So, regardless of whether debug() was called, the f-string was always expanded. In this case, df contained my entire database, so the culprit had likely been found. I commented it out, and the spike was gone.
Epilogue:
The point of this article is not just to avoid using f-strings, but to present the memory tracking tools that I found useful. This was not a syntax error, so most static code analyzers do not catch it. Wouldn’t it be nice if there were a tool that looked at every line of my code - even the one-off debug lines - with the eye of an experienced coder? In fact, there are several tools that have been trained on large code bases to predict where a problem likely is. Metabob is quite easy to set up in github, so I tried it on this code snippet. Upon signing-in to the tool, this screen pops up within seconds:
Substituting the f-string with a % style “lazy formatting” allows me to keep my logging line and eliminate the spike:
logger.debug("df is \n%s" % df.to_string())
In fact, I had run this tool on my code several times, but didn’t think to run it after adding the debug statements. Had I run this more frequently, I might have saved weeks of work hunting down the memory spike.
My takeaways:
If your program is terminating due to memory error at wildly different places on AWS, look for a spike rather than a leak
Setting the system memory resource limit is much more useful than pympler and Python’s other memory profiling tools, because it gives a stack trace.
Running my code through Metabob after each code commit - not just before adding debug statements - would have saved me weeks of work.
Ben Reeves
Director of AI
Ben holds an MS from Stanford and 35+ years experience as an NLP engineer in high growth startups and in big corporations such as Panasonic and Toyota.